Reporting & Analytics
Compose delivers real-time reporting and analytics that give you a complete picture of your organization’s people, compensation, and equity data – putting actionable insight at your fingertips.
It’s easy to use and highly responsive, and it gives you what you need to thrive through ever-shifting markets to attract, engage, and retain amazing talent.


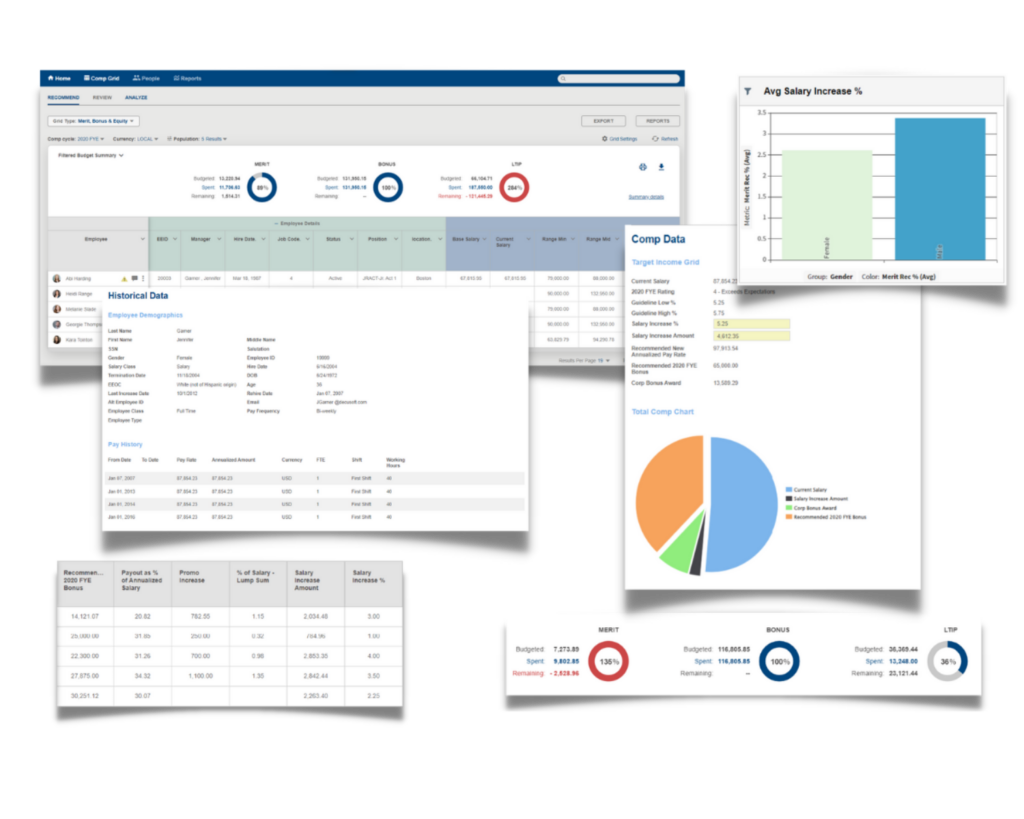
Real-Time Reports & Dashboards
Updates, changes, and modifications to plans, budgets, and payments are all factored into analytics in real-time. Tailor dashboards for various roles and make them an integral part of the planning process. Condense your processing and reporting time without the need to rerun reports for every change.
- Report wizards make it easy to create sophisticated views drawing from multiple data tables.
- Display information as preset PDF reports, dashboard visualizations, or interactive pages.
- Enable data exploration not just static dashboards – run variations, change scope, and leverage Compose AI to bring data to life
- Define the scope of any report: A single employee, a group of employees, or totals by organizational unit.
Data Integration & Benchmarking

Easily integrate compensation analytics and benchmark data into your planning process so that you can model and analyze pay equity impact and compare to market trends.
- Import 3rd party benchmarking data to evaluate your employees’ compensation against industry benchmarks.
- Ensure consistency of evaluations and rewards between teams.
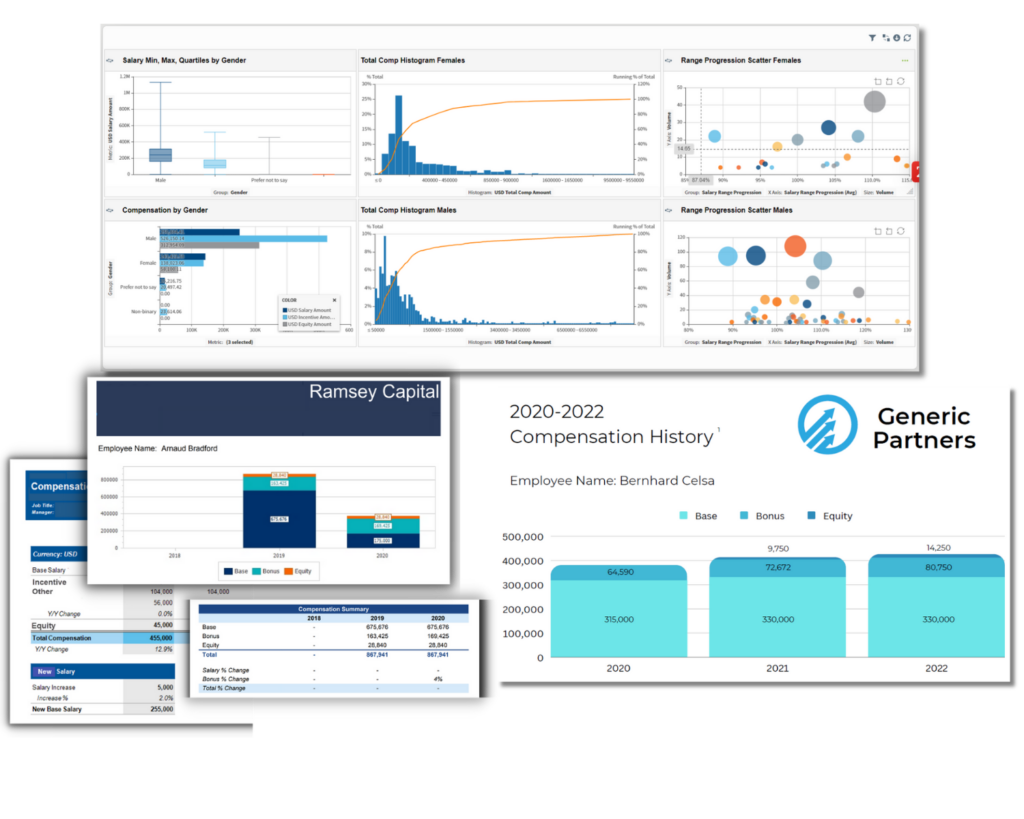
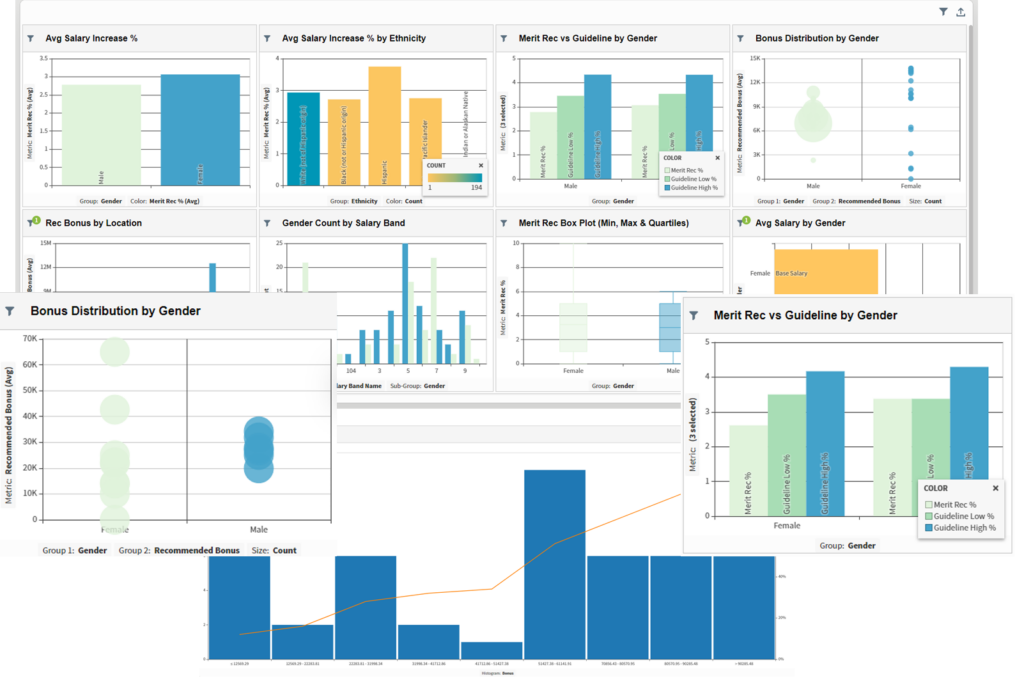
Pay Equity
Data Access
Comprehensive access to visualizations of compensation distribution broken down by demographic information and other relevant factors.
Data-Driven Decision Making
Monitor performance evaluations, salary progression, and other factors to drive data backed decisions. Solidify your planning and execution with data to stay agile and adjust as needed.
Compliance
As legislation requirements continue to be created and modified, take advantage of having a trackable, reportable, and auditable record of your actions.
- Comprehensive visualizations of compensation distribution by demographic factors.
- Monitor performance evaluations, salary progression, and other measures for a full view of pay equity issues.
- Dashboards for senior executives, board members, and investors.
Data Driven Decisions
Your data is brought to life through visuals, reports, and actionable metrics. All of your data history is available, create the tailored reports and dashboards you need to satisfy your requirements.
- Manage and track forfeitures and overrides
- Set allocations and metrics
- Distribute rewards
- Communicate to employees
- Monitor progress
Learn more about the reporting & analytics capabilities of Compose by contacting us today.

Subscribe for compensation news, trends, whitepapers, and insights.
Compensation Newsletter
- Clients
- Who we work with
- Resources
- Content
- Videos & Collateral
- News
- Company
- Our Story
- Careers
- Leadership
- Contact Us
© 2025 Decusoft. All rights reserved.